Throughout the book we have been principally been concerned with monitoring, recording, analysing and displaying numerical data from instrumentation.
Our weather is constantly changing and the recording in words and images of other weather phenomenon can add considerably to the wealth of material and the interest of the hobby. To illustrate this aspect I will illustrate a few of the possibilities, some from my own experience. Recording the date and time of such phenomenon is invaluable additional information.
Hail
Snow – wet and dry
Everybody is familiar with the sight of snowflakes. Snow is formed when temperatures are low and there is moisture – in the form of tiny ice crystals – in the atmosphere. The size and make up of a snowflake depends on how many ice crystals group together and this will be determined by air temperature. Snowflakes that fall through dry, cool air will be small, powdery snowflakes that don’t stick together. This ‘dry’ snow is ideal for snow sports but is more likely to drift in windy weather. When the temperature is slightly warmer than 0 °C, the snowflakes will melt around the edges and stick together to become big, heavy flakes. This creates ‘wet’ snow that sticks together easily.
Snow Grains
This is precipitation in the form of very small, white particles of ice, which is the equivalent of drizzle in a solid form.
Snow Pellets
This is precipitation that consists of white, almost round ice particles that have a snow like structure and are about 2-5 mm in diameter.
Sleet
Sleet is often mixed with rainfall when storms pass over and the temperature drops, which causes a freezing of some raindrops thus producing snow that partially melts as it falls.
Fog
Cloud
At the time of morning observation another useful item of data that can be noted is the amount of cloud cover, which is calculated in eights or ‘oktas’. It is suggested that no calculation of the cloud depth is made. The record can be quite simple, for instance, a clear sky is noted as (0/8), just a trace of cloud will be recorded as (1/8) and total cloud cover as (8/8).
The enthusiast can make a study of the various cloud formations and add this detail to the records. The Meteorological Office website has an excellent illustrated guide to the various cloud formations. There are 10 cloud types that are broken down into three groups. The low-level clouds encompass stratus, cumulonimbus, cumulus, nimbostratus and stratocumulus that are found between 0 and 2,000m. Mid-level clouds that cover altitudes 2,000m – 6,000m are called altostratus and altocumulus. Finally three types cover the altitude 6,000m and above, namely cirrostratus, cirrocumulus and cirrus.
Funnel Cloud
There are more unusual phenomena that occasionally occur. I will include such a happening that I witnessed from my station just once in the last thirty years and which appeared briefly for perhaps five minutes. The image shows the funnel cloud that began to form which continually changed size and shape over the period. A photographic record of such an occurrence, to accompany date, time and compass heading of the funnel cloud, would be ideal. All the aspects covered above can only be made when you are present at your station. Holidays prove a problem to maintain continuous records when you are absent if you are not fortunate enough to have an automatic weather station. Perhaps a friendly neighbour might be requested to make the observations you require and prevent a gap in your data.
Other Phenomena
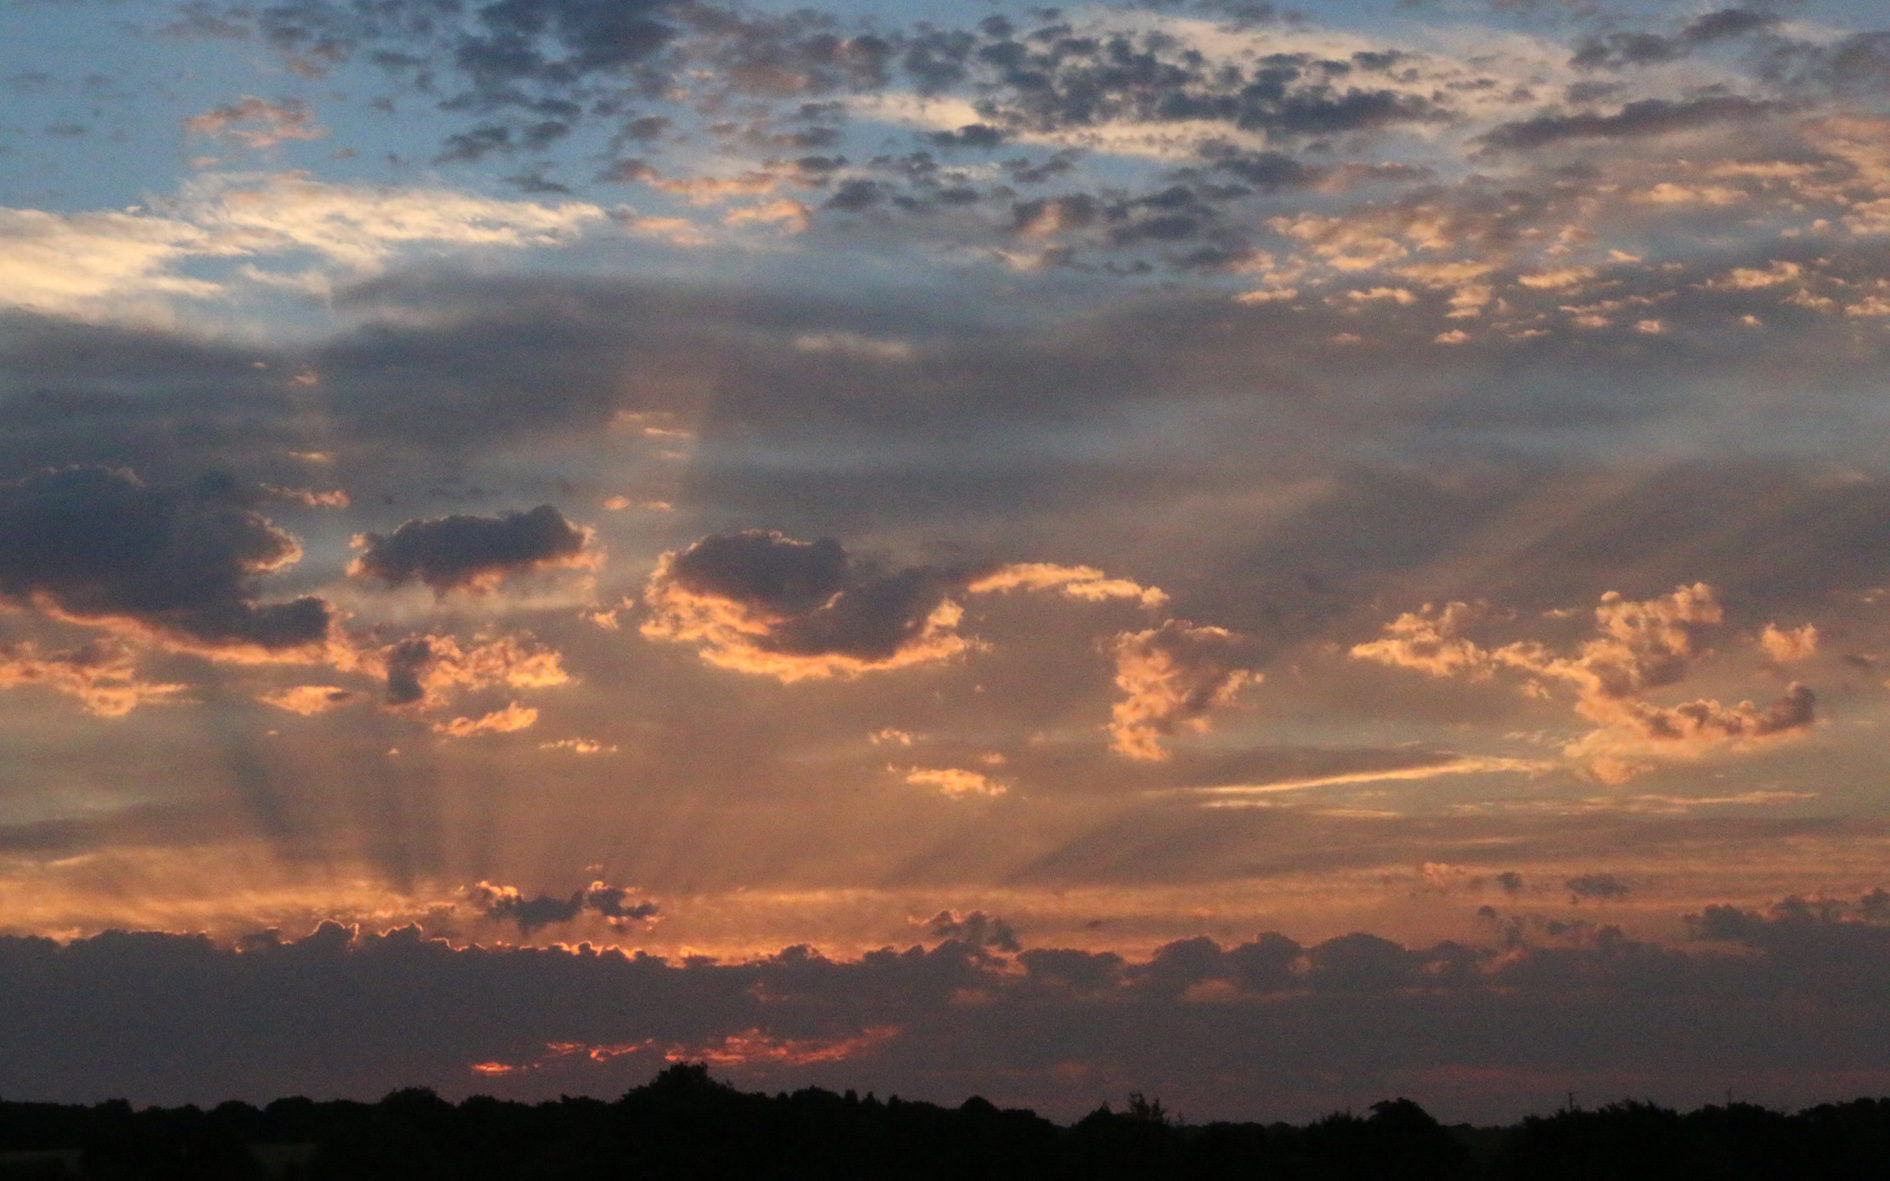
From time to time it is worth making a photographic record of interesting cloud formations, shapes and colours, especially at daybreak and sunset. A selection of my images head each chapter. Sometimes a magnificent rainbow can be seen and occasionally it is positioned to make an interesting picture. Finally, linking with a group of enthusiasts who have the same interests adds interest to the hobby. Requesting to join a group of like-minded serious amateurs and professionals, such as the Climatological Observers Group, provides the information on a national basis that can be collated into a monthly report, which is then available to all members. This database can be of use to professionals as although the Meteorological Office has numerous official weather stations, often storms or particular phenomenon occur on a very localized basis.


