The almost wall to wall sunshine on Monday raised the temperature to a maximum of 16.9C late afternoon at 16.19 being a significant 6.3C above my long-term average. It was the 21st dry day but more significant was that the UV level peaked at 4.0, which took it into the ‘High’ category.
Under the high pressure and clear skies the sunny, warm days are followed by chilly nights and last night saw the thermometer fall to a minimum of 3.4C at 06.05 early Tuesday, thus no air frost, being 0.7C above average.
Tuesday brought an overcast start to the new day. The high pressure has relocated to be centred over Denmark and southern Scandinavia with the resultant airflow, moving anticlockwise, coming around its southern flank and having backed into the east for today. This wind direction picked up moisture as to travelled across the cool North Sea and consequently drifted across during the night, however, shortly after 09.00 the sun began to break through and shine strongly.
March 2025 Review
The month began with a dominant, large high-pressure system that extended from the UK to the Black Sea, which gave us wonderful days with clear blue skies and wall to wall sunshine. After the wet end to February the loss of equivalent rainfall through evaporation from ground sources was over 1mm per day with 1.70m logged on the 4th.
The downside to the clear skies were the inevitable air frosts overnight with a low of -5.2C logged in the early hours of the 3rd, being 7.8C below the long-term average. The following days brought glorious wall to wall sunshine with the maximum rising each day culminating in a peak of 17.4C on the 9th being a significant 6.7C above my long-term average making it the warmest day since 17th October.
Sadly, it was all change from the 11th as the air began to arrive from the Arctic. The following days and nights were cold with wind chill and air frosts at night. The air was directed from the north and northeast between an anticyclone to the west, with its air circulating clockwise, and a depression over Scandinavia and then the Continent with its associated air circulating anticlockwise, down over the UK. There was quite a squeeze between the two weather systems. With the wind increasing in strength, a maximum of 20mph was logged on two days that produced a significant wind chill making it feel much colder outside than indicated on a thermometer.
There were seven days when the maximum temperature was well below average and clear skies meant overnight hard frosts with a minimum of -3.2C in the early hours of the 14th, which was a significant 5.2C below my long-term average. However, there was a sign that the sun was beginning to get stronger as the UV level on the 14th and 15th rose into the ‘Moderate’ level for the first time since 5th October.
Thankfully, a rise in pressure and change in wind direction from northeast to east then southeast from the 19th brought milder temperatures with the first rain after eight consecutive dry days. A rainfall of 2.9mm on the 21st was the wettest day since 26th February. The maximum temperatures returned above average from the 18th with a high of 19.8C on the 20th, being a significant 9.1C above my long-term average.
Signs that the sun was getting stronger were recorded on the 26th, under periods of strong sunshine, when the UV level rose to a peak of 4.4, being at the top end of the ‘Moderate’ level, the highest since 17th September.
There was another drier, warmer period from the 24th, under a ridge of high pressure, that meant the wind backed into the southwest as the centre of the anticyclone relocated, not seen since the 5th March.
The month ended with a dominant high pressure over southern England that gave us many hours of glorious sunshine and more dry days.
The diurnal temperature range, the difference between night and day extremes, was logged over the 27th/28th at just 2.7C (10.8C and 8.1C). Contrasting those figures was a diurnal range of 15.7C over the 30th/31st (16.1C and -0.4C).
The past month broke the record for the driest March I have logged since this station was set up in 1984. We have enjoyed 26 dry days. The total rainfall was just 5.3mm being only 8.3% of the 41-year record or minus 57.6mm. The BBC stated on the 29th that the average for southern England was 25%, so we had an exceptionally dry month in Marlborough. The wettest day on the 21st only produced 2.9mm, being over half the month’s rainfall. There is one other major factor to bear in mind as the ground dried out, the equivalent loss of rainfall through evaporation from ground sources and plant life was 50.1mm. A daily loss of over 2mm was recorded on 9 days with a peak of 3.00mm on the 30th.
The records show that the driest March months were in 2011 with 12.7mm and 1997 with 15.6mm. By way of contrast the wettest March was in 2023 with 163.3mm, the second wettest March was in 2018 with 130.9mm.
The precipitation statistics were made using a standard Metrological Office 5inch copper rain gauge. This data was backed up by my automatic rain gauge.
It was a relatively warm month being 0.7C above my long-term average. That disguised the fact that the maximum was 2.1C above average due to the sunny, dry days but the minimum was 0.7C below average due to the 13 nights with an air frost that were particularly hard at the beginning of the month.
Fog was observed on four days with thirteen mornings when an air frost had developed under clear skies.
Finally, Lincoln University had requested, via my national meteorological organisation linked to the Met Office, extensive data as the partial eclipse on the 29th occurred. For this I recorded the data every 10 minutes from 00.00 on Saturday up to 09.30, then every minute until 12.30, lastly back to a ten-minute interval until 19.00, supplying five items of meteorological data at each time interval. During the period of the eclipse there was changeable, very light cloud that gave variable solar radiation data but it was noticeable that the air temperature was very stable, with minimal variation of 11.1C or 11.2 between the lengthy period of over an hour between 10.16 and 11.25, even though the sun was shining brightly. Over that period the solar radiation varied from 603W/m2 to 339W/m2 at the time of the greatest coverage of the sun by the moon. The thermometer eventually gave a maximum of 13.3C at 15.25, which was a little depressed as after the eclipse had ended there was a significant increase in wind speed. The data was limited to those with professional equipment that was naturally aspirated and radiation shielded, also sited away from buildings and hard surfaces.
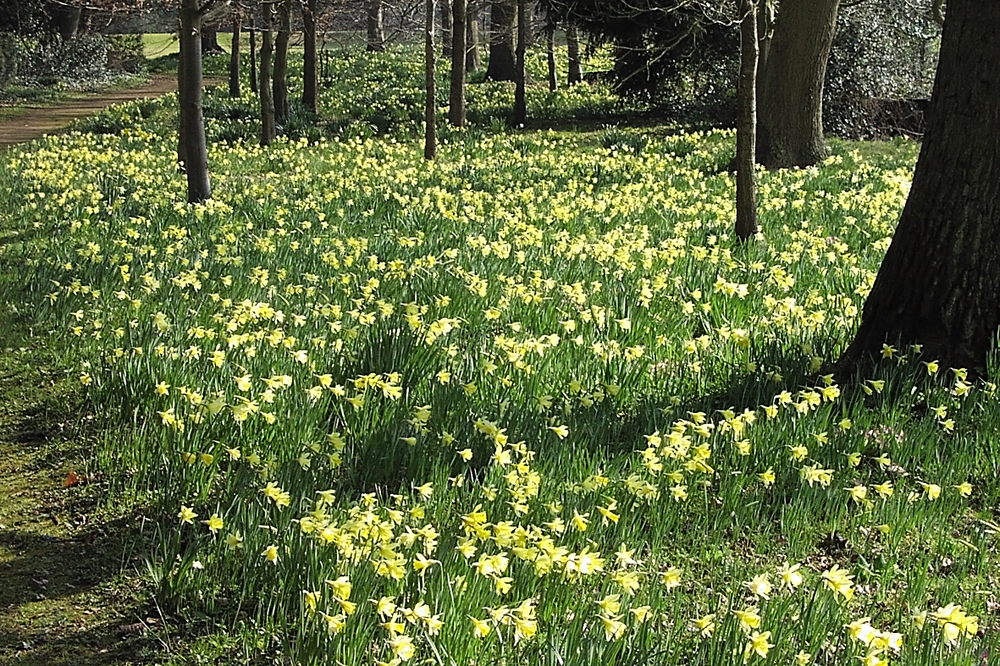
The next few images were taken in Priory Gardens when I was preparing images for the Marlborough in Bloom portfolio and presentation in 2015 when we won Gold.