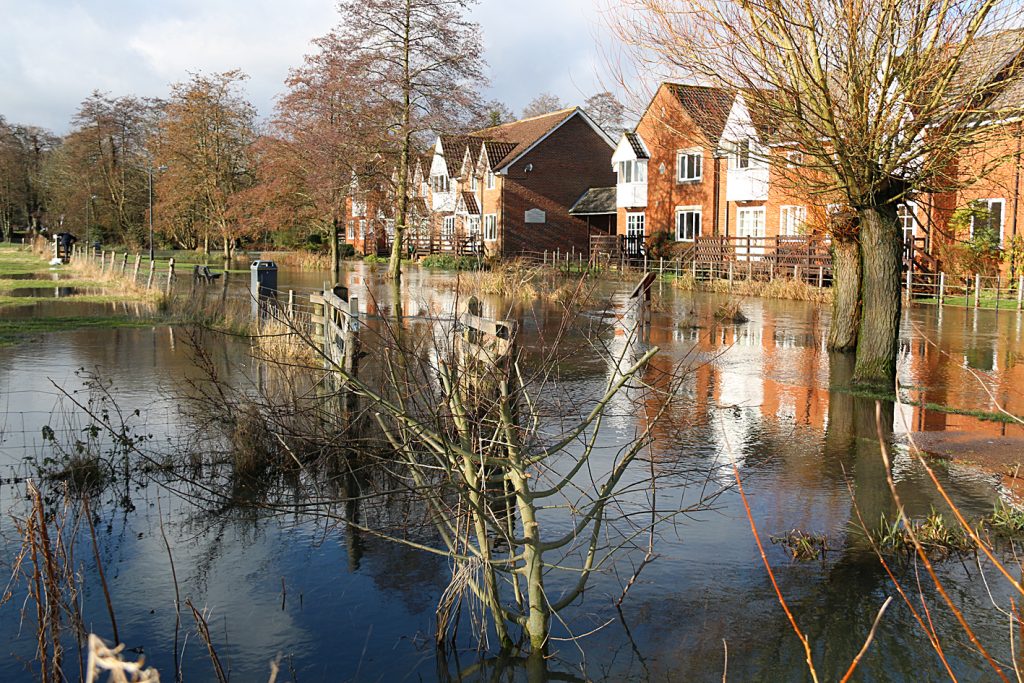
Our weather varies from month to month and year to year but research into data over a long period, such as 30 years, can often reveal a pattern.
Since my records began in 1984 the trend for heavy daily rainfall totals has certainly been increasing. Taking an arbitrary daily rainfall total of 10mm or greater over a twenty-four hour period, the trend for such occurrences shown on a straight line graph have been upward from 22 to 28 occasions each year. A similar but less pronounced trend is evident when daily rainfall totals of 20mm or more are analysed, which show an upward trend this time from 3 to 6 occurrences over the past 31 years.
The wettest day since 1984 was on 23rd December 2013 when 46.4mm was recorded. It is interesting to note that 10mm of rainfall equates to 10 litres of liquid for every square metre. Simple arithmetic will show on that occasion each square meter of land received over 46 litres or 10 gallons. The recommended dimensions of a football pitch give an area of approximately 7,150 square metres. Therefore on that day an average football pitch would have received 71,500 litres of rain or nearly 16,000 gallons. That is a lot of liquid to disperse.
Further research into heavy rainfall in Marlborough, and taking 40mm and above as an arbitrary figure, I note that such a daily total did not happen in the 1980s or 1990s. The first occasion was in October 2000 with 40.6mm. There have been six days with daily rainfall totals in excess of 40mm and that the pattern underlines the statement from the Meteorological Office that such extreme events are happening more regularly is correct. The second occasion was in 2002 (41.0mm), then 2007(45.4mm), followed in 2010 (41.7mm), 2013 (46.4mm) and most recently in 2014 (40.6mm).
We are told that the world is warming and we know that warmer air holds more moisture, which eventually falls to earth. Therefore it is not surprising to find such considerable rainfall totals are occurring more frequently. Personal observation over the years has revealed that in the summer months, when extreme rainfall arrives from the continent, it often moves northwards to the west or east of Marlborough. Often when watching the 5min rainfall radar I have noticed the rain shower diminish or move to either side of the local area.

To underline the variability of our climate, 1996 was the driest year since 1984 with just 540mm and the wettest year in 2002 with over twice that total at 1146mm when the average is 840mm.
All my rainfall statistics are taken when using the standard Meteorological Office 5 inch copper rain gauge. Automatic gauges are very useful to provide ‘live’ data but being off the ground can be up to 20% inaccurate due to wind movement and also are only precise to 0.2mm, not 0.1mm as with the copper gauge.

